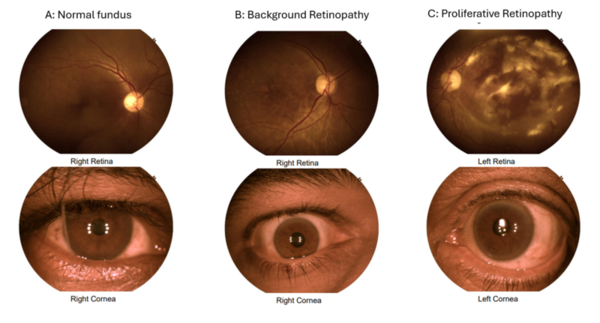
The purpose of our study was to examine the correlation of glycosylated hemoglobin (HbA1c), blood pressure (BP) readings, and lipid levels with retinopathy. Our main hypothesis was that poor glycemic control, as evident by high HbA1c levels, high blood pressure, and abnormal lipid levels, causes an increased risk of retinopathy. We identified the top two features that were most important to the model as age and HbA1c. This indicates that older patients with poor glycemic control are more likely to show presence of retinopathy.
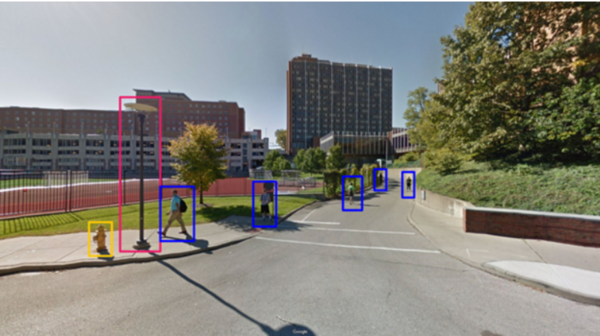
Every year, around 40% of undergraduate students in the United States discontinue their studies, resulting in a loss of valuable education for students and a loss of money for colleges. Even so, colleges across the nation struggle to discover the underlying causes of these high dropout rates. In this paper, the authors discuss the use of machine learning to find correlations between the built environment factors and the retention rates of colleges. They hypothesized that one way for colleges to improve their retention rates could be to improve the physical characteristics of their campus to be more pleasing. The authors used image classification techniques to look at images of colleges and correlate certain features like colors, cars, and people to higher or lower retention rates. With three possible options of high, medium, and low retention rates, the probability that their models reached the right conclusion if they simply chose randomly was 33%. After finding that this 33%, or 0.33 mark, always fell outside of the 99% confidence intervals built around their models’ accuracies, the authors concluded that their machine learning techniques can be used to find correlations between certain environmental factors and retention rates.
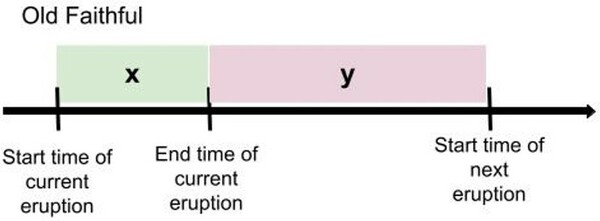
The purpose of the study was to determine whether graph-based machine learning techniques, which have increased prevalence in the last few years, can accurately classify data into one of many clusters, while requiring less labeled training data and parameter tuning as opposed to traditional machine learning algorithms. The results determined that the accuracy of graph-based and traditional classification algorithms depends directly upon the number of features of each dataset, the number of classes in each dataset, and the amount of labeled training data used.
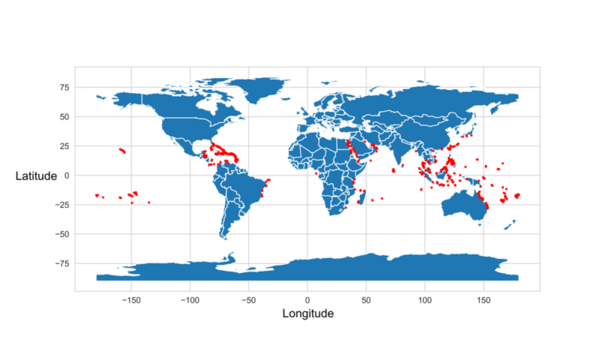
Coral bleaching is a fatal process that reduces coral diversity, leads to habitat loss for marine organisms, and is a symptom of climate change. This process occurs when corals expel their symbiotic dinoflagellates, algae that photosynthesize within coral tissue providing corals with glucose. Restoration efforts have attempted to repair damaged reefs; however, there are over 360,000 square miles of coral reefs worldwide, making it challenging to target conservation efforts. Thus, predicting the likelihood of bleaching in a certain region would make it easier to allocate resources for conservation efforts. We developed a machine learning model to predict global locations at risk for coral bleaching. Data obtained from the Biological and Chemical Oceanography Data Management Office consisted of various coral bleaching events and the parameters under which the bleaching occurred. Sea surface temperature, sea surface temperature anomalies, longitude, latitude, and coral depth below the surface were the features found to be most correlated to coral bleaching. Thirty-nine machine learning models were tested to determine which one most accurately used the parameters of interest to predict the percentage of corals that would be bleached. A random forest regressor model with an R-squared value of 0.25 and a root mean squared error value of 7.91 was determined to be the best model for predicting coral bleaching. In the end, the random model had a 96% accuracy in predicting the percentage of corals that would be bleached. This prediction system can make it easier for researchers and conservationists to identify coral bleaching hotspots and properly allocate resources to prevent or mitigate bleaching events.
Here the authors examined a population of Massachusetts marine isopods, seeking to classify them based on comparison of their morphology, movement, and seaweed preference compared to those of known species. In this process they found that they were most similar to Idotea balthica. The authors suggest that this knowledge combined with monitoring populations of marine biology such as these isopods in different physical and ecological areas can provide useful insight into the effects of climate change.
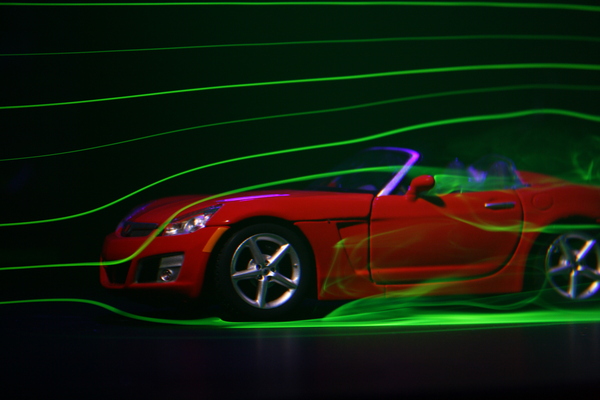
Energy efficiency is becoming more important as we struggle to find better, more sustainable energy sources to power our planet; the car industry is no exception. In this article, the authors examine the effect of shape on automobile aerodynamics By finding the shape that makes cars less resistant to wind, and therefore more energy efficient, can help the automobile industry make better, more eco-friendly cars that are also cheaper to operate.
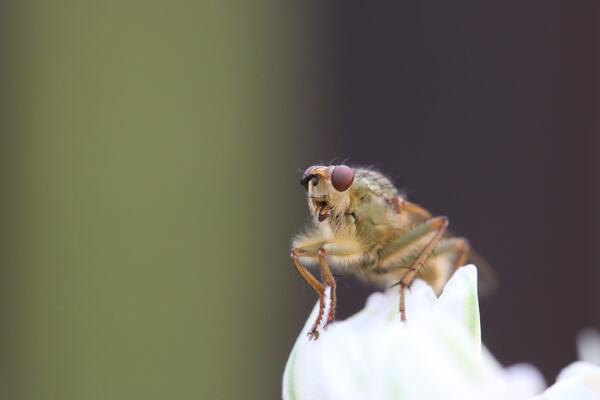
Dhar and colleagues established a Type II diabetes mellitus (T2DM) model in fruit flies, using this model to induce insulin resistance and characterize the effects Resveratrol and Pterostilbene on a number of growth and activity metrics. Resveratrol and Pterostilbene treatment notably overturned the weight gain and glucose levels. The results of this study suggest that Drosophila can be utilized as a model organism to study T2DM and novel pharmacological treatments.
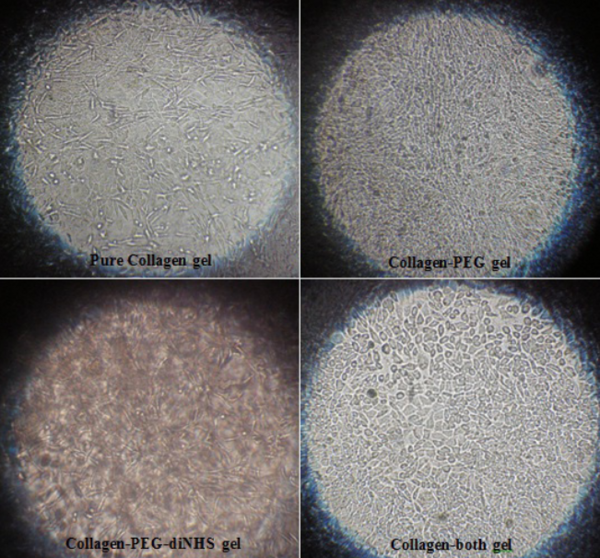
Environment affects the progression of life, especially at the cellular level. This study investigates multiple 3-dimensional growth environments, also known as scaffolds or hydrogels, and their effect on the growth of a type of cells called fibroblasts. These results suggest that a scaffold made of collagen and polyethylene glycol are favorable for cell growth. This research is useful for developing implantable devices to aid wound healing.
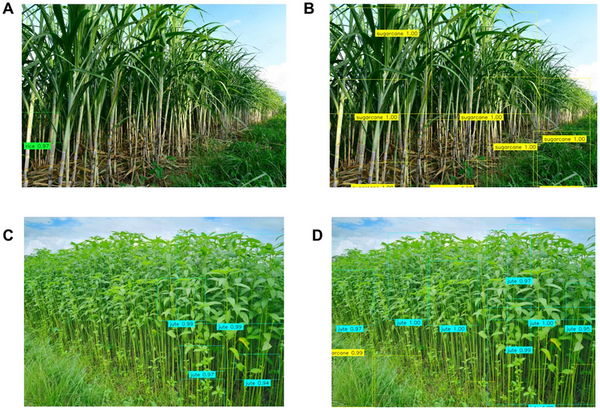
Multi-perspective drone imagery (adding oblique views to top-down shots) raised crop classification accuracy from 35.73% to 52.93% across five species. The improvement scaled with canopy complexity, from +4.2% for simple rice to +38.1% for structurally complex sugarcane.